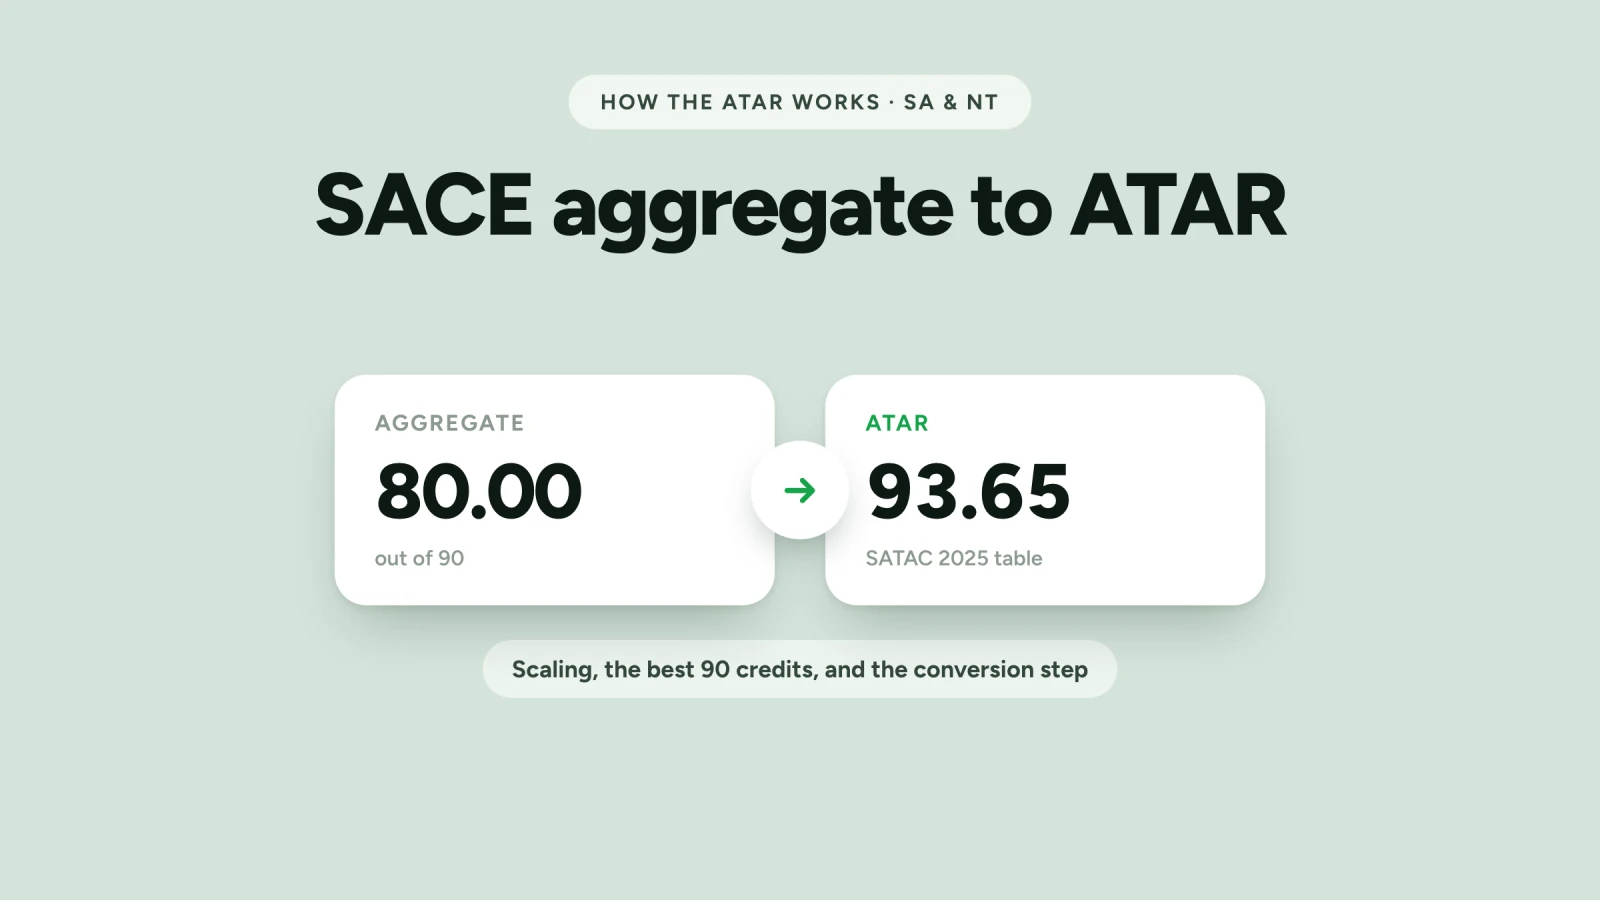
SATAC converts your SACE/NTCET university aggregate - the scaled scores of your best 90 credits, out of a maximum of 90 - into an ATAR using an official conversion table it rebuilds every year. Below are the anchor points from SATAC's 2025 table: what each aggregate converted to last year.
This is a prior-year guide, not a prediction. Prior-year information cannot accurately predict ATARs for future students. The relationship between the university aggregate and ATAR changes every year and depends on the SA + NT 16-20-year-old population. Indicative of the 2025 curve only, not a prediction. And because SATAC publishes no per-subject scaled scores, you can't build your aggregate in advance - so treat this as how the aggregate maps to a rank, never a forecast of your ATAR.
2025 aggregate-to-ATAR anchor points
The full SATAC table runs in 0.05 aggregate steps (1,801 rows). These whole-number anchors show the shape of the 2025 curve:
| University aggregate (/90) | ATAR (2025) |
|---|---|
| 90.00 | 99.95 |
| 85.00 | 97.65 |
| 80.00 | 93.65 |
| 75.00 | 88.45 |
| 70.00 | 82.20 |
| 65.00 | 75.75 |
| 60.00 | 69.30 |
| 55.00 | 62.95 |
| 50.00 | 56.45 |
| 45.00 | 50.25 |
| 40.00 | 43.60 |
| 35.00 | 36.55 |
| 30.00 | 27.55 |
For the exact ATAR at every 0.05 aggregate step, see SATAC's full 2025 aggregate-to-ATAR table.
How your aggregate is built
Your university aggregate is the sum of the scaled scores of your best 90 credits - three 20-credit Tertiary Admission Subjects (60 credits, each scored out of 20) plus a 30-credit flexible option. That gives a maximum aggregate of 90.00, which mapped to an ATAR of 99.95 in 2025.
The full mechanics - the flexible option, Recognised Studies, and how SA and the NT are ranked together - are on how the SACE ATAR is calculated.
Frequently asked questions
What ATAR does a SACE aggregate of 80 give?
In SATAC's 2025 conversion, a university aggregate of 80.00 (out of 90) corresponded to an ATAR of 93.65. But the aggregate-to-ATAR relationship is recalculated every year against the SA and NT cohort, so this is indicative of the 2025 curve, not a prediction of your ATAR.
Can I use this table to predict my ATAR?
No. SATAC states plainly that prior-year information cannot accurately predict ATARs for future students - the curve shifts every year with the population. You also can't build your aggregate in advance, because SATAC doesn't publish per-subject scaled scores. Treat the table as a guide to how the aggregate maps to a rank, not a forecast.
What is the university aggregate out of?
Out of 90. It's the sum of your best 90 credits of scaled scores - three 20-credit Tertiary Admission Subjects (scored out of 20 each) plus a 30-credit flexible option. A maximum aggregate of 90.00 converted to an ATAR of 99.95 in 2025.
Does this apply to NTCET students?
Yes. SATAC's table is for 'SACE/NTCET' and ranks SA and NT students together, so the same conversion applies to Northern Territory (NTCET) students.
Data: 2025 SACE/NTCET university aggregate to ATAR (SATAC). Figures are the official 2025 conversion, transcribed exactly; the relationship is re-stamped when SATAC publishes the new table each December. This page covers the South Australian and NTCET system only.